CULTURE
MAPPING
Know what your culture really feels like. Not just what it says on the website.
You can't fix what you can't see clearly
Most leaders have a sense of their culture. They know the values they talk about and the kind of environment they want to create. But as teams grow, culture becomes harder to read.
Different teams experience things differently. New leaders bring different ways of working. Messages that feel clear at leadership level land very differently elsewhere in the organisation.
Culture mapping makes that visible. It shows what people are experiencing day to day, where things are working well, and where leadership attention will make the biggest difference.
culture-essential themes covered every time we run the tool
core principles assessed across every organisation
eNPS
included every time so you have a benchmark to measure against
When
you need it. Used for re-runs, townhalls, board reports, B Corp and more
"HappyHQ's culture audit pinpointed the changes we needed to make and demonstrated all the great things about our culture that we're now celebrating"
Jazmin Gray, People and Culture Manager, Gibsons
Insight only becomes useful when it leads to action.
The 8 Core Principles
A framework built around how people experience work every day
Rather than treating culture as something abstract, we assess the behaviours and leadership habits that shape day-to-day experience across eight areas. Each principle is scored, giving you a clear picture of where you’re strong and where attention will make the biggest difference.
The culture wheel shows how your organisation scores across all eight at a glance, and how that picture changes each time you run it.
Wellbeing
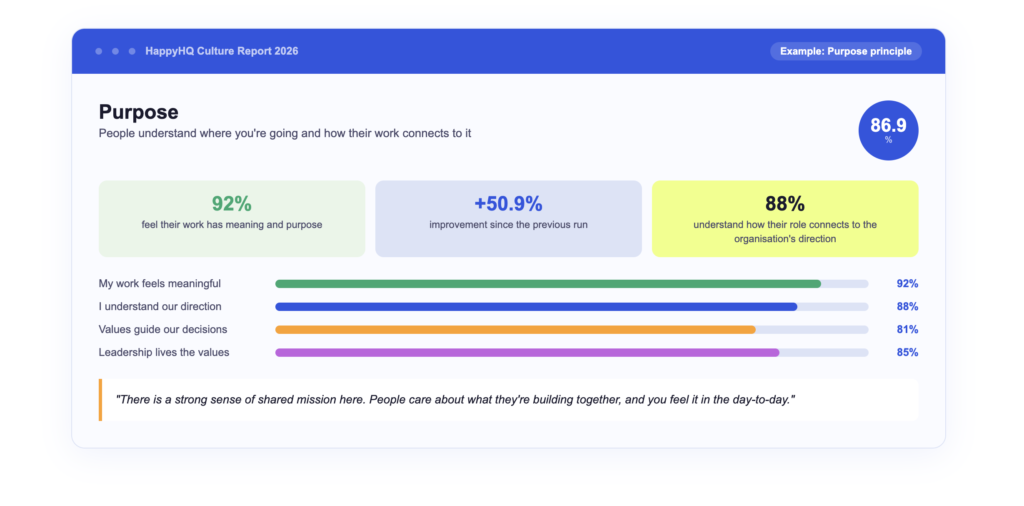
Purpose
Communication
Leadership
Connection
Empowerment
Appreciation
Belonging

The difference it makes
Culture change is measurable. Here's what that looks like.
When you run it again, you get a before and after. A clear picture of what has shifted and where to focus next.
Score
Before
After
Wellbeing
65.6%
76%
Purpose
36%
86.9%
Communication
56.2%
79.7%
Leadership
64.6%
65.1%
Connection
84.9%
76.8%
Empowerment
64%
82.1%
Appreciation
44.7%
67.3%
Belonging
61.8%
81.2%
Overall Score
59.9%
First run
76.7%
Six months later
+16.8 percentage points across two runs. Seven of eight principles improved. Purpose showed the biggest shift, from 36% to 86.9%.
ENPS Score
50
Excellent tier
Included every time. The number that tells you everything.
Benchmarks: Below 0 is poor. 0 to 20 needs work. 20 to 40 is good. Above 40 is excellent. The global average across industries sits in the low 20s.
A scored, visual report. Built for action, not filing.
The 8 Core Principles
💙
People feel supported and can talk openly about pressure.
🎯
⚡
⭐
The data doesn't stop at the presentation.
🎤
📊
🌱
🗓
💬
📋
Four steps. A clear picture. A practical direction.
01
We start by understanding how culture is experienced across your organisation. This includes leadership interviews, an all-team culture audit covering 70 culture-essential themes, and an eNPS score. Employees share feedback anonymously, giving everyone a genuine chance to have their say.
02
Culture mapping and insight
Once the information is gathered we look for patterns. Where are teams aligned? Where are experiences different across departments? Where are leadership intentions not landing as expected? We score each of the 8 Core Principles and share findings in a culture report that can be adapted for leadership teams, boards or wider all-hands presentations.
03
04
Many organisations choose to continue through coaching, leadership sessions or regular check-ins. We re-audit every six months so you can see what has changed, track the impact of your work, and make sure momentum keeps building.
What changes, and why it stays changed
01
You see what you couldn't before
The tool captures what people are genuinely experiencing, not just what leaders think is happening. That gap is often the most valuable thing to understand.
02
The work is useful on Monday
03
Everyone feels heard
04
You can see the impact over time
Running the tool again when the time is right means culture doesn’t become a one-off project. You get a clear before and after, and a way to keep tracking progress as your organisation grows.
Tildey Large, HR Manager, The Halo Group
Built for leaders who want to know what's really going on
Whether you’re growing quickly, navigating change, bringing teams together or trying to understand the gap between what leadership thinks is happening and what employees are experiencing, this is for you.
Leaders leave with clarity, not just data
- A clear view of how culture is experienced across the organisation
- Scores across all 8 Core Principles so you know exactly where to focus
- Culture decisions based on evidence, not assumption
- A team that feels listened to and involved in shaping change
- A practical action plan, not just a report
- A baseline to measure against as the organisation evolves
Ready to see your culture clearly?
Get in touch to talk through what your organisation needs, or to find out more about how the HappyHQ Culture Tool works.
Or email hello@happyhq.co.uk